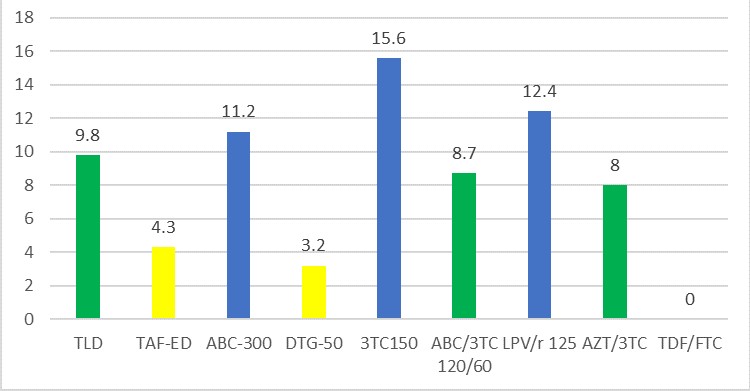
Is the following chart possible in DHIS2 (bars in a series having different color based on legend value range) -
Hi @Mahmud,
Yes, this feature will be available in the upcoming 2.36 release. You can check it out for yourself on DHIS 2 Demo - Sierra Leone.
Simply make a bar chart in the data visalizer app. Then in the options menu go to the legends tab and apply a legend.
All the best,
Scott
2 Likes
Good to know @Scott , my client has 2.31.9, I already explained that it is not possible in their version.
Thank you @Scott , it is working for me in DHIS2 version 2.36.6
2 posts were split to a new topic: How to download the Data Visualizer app charts into excel?