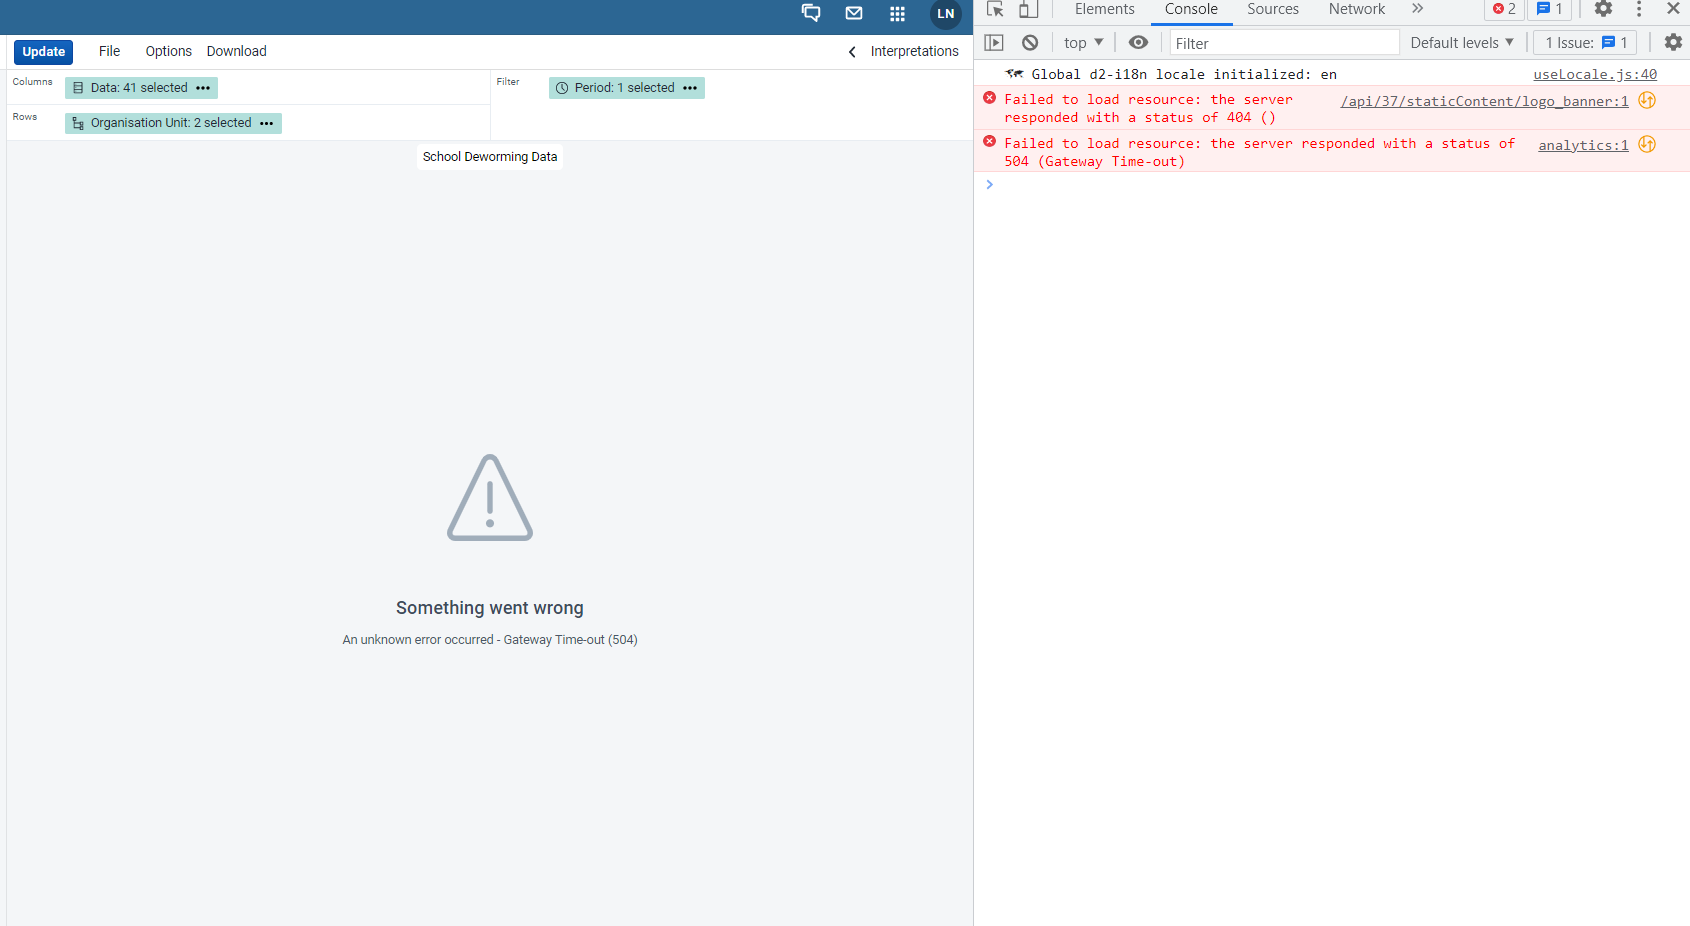
When we are configuring a pivot table, we observed that when there are too many indicators, report times out with a ‘504 Gateway Time-out’ imposed by chrome browser. The time-out limit set by chrome browser is 1 minute. Because of this issue we are unable to configure tables with many indicators.
How can we fix this issue? Is there any workaround ?
This is an nginx /tomcat timeout, not something intrinsic to the browser. You can try and increase the Nginx timeouts for this with proxy_connect_timeout, proxy_send_timeout, etc. as described in the nginx documentation on your DHIS2 server. You may also need to request less data, or increase the size of your server, optimize the database, etc to speed things up. In general though, this is looks like the usual “asking for too much data” problem which can be a more general problem. Even if you manage to avoid the 504, you may return too much data to the browser, resulting in an “Aww snap” message, or worse, choking the server. The pivot tables are not designed to handle large data sets. By large, its a bit subjective and depends on many things, but if you see these issues, I would try and break down the pivots into smaller, more manageable pieces if possible.
When we are configuring a pivot table, we observed that when there are too many indicators, report times out with a ‘504 Gateway Time-out’ imposed by chrome browser. The time-out limit set by chrome browser is 1 minute. Because of this issue we are unable to configure tables with many indicators.
How can we fix this issue? Is there any workaround ?