Visualization issue

Hi @Scott,

We are building a tracker program for mentoring health providers to improve their own work performance continuously. It consists of different checklists (configured as repeatable stages in order to allow multiple events to be conducted) with scores that are computed using program indicators per health provider.

Using a line list, we can view different events conducted per health provider in event report,

But values computed (Program indicators) per health provider obtained in different events are not displayed. How can we view scores per each health provider in a line list as we do with raw event data?

In the following demo, we have three events for one individual

How to show all scores he got per event in an event report?

Looking forward to a reply

Thanks

Hello @hernandezmachava

Thanks for your question. Before I answer it I would like to explain my understanding of your use case and your problem.

In your Mentoring tracker program, each enrollment is for a specific care provider. The repeatable stage contains a checklist of data elements about the care provider’s work performance. This checklist can be completed multiple times. A program indicator then computes a summary score for each event separately.

You would like to see a list of the summary scores for a given care provider (enrollment).

From there I am unclear about how you would like them displayed. You mention that you would like to display the events in a Line List, however your screenshot shows a program indicator within the program indicator widget of the tracker capture app.

For each of the following configurations below, you should be sure you are using an event-type program indicator.

If you want to show program indicator values within an event report in a “long” format:
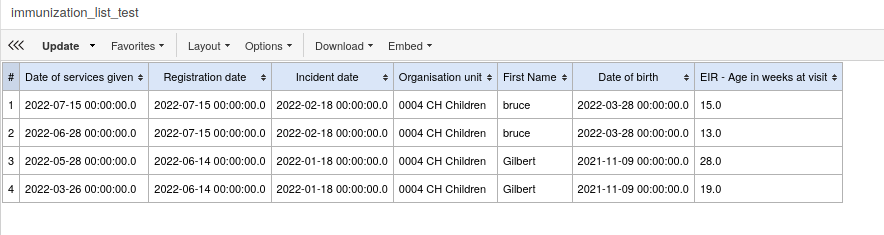
You can show an event-type program indicator in the event report, as such. The program indicator for each event is its own row, so the TEI attributes are repeated.

If you want to show program indicator values within an event report in a “wide” format:
To show event-type program indicator values for each event, where each event is on the same row as its enrollment, then you will need to use the “Line Listing” application to create a “wide” report. You can use the same program indicator, but the value for each of the previous x events is displayed in separate columns. See the two columns at the right, which show the same program indicator for previous two events.

This is available only in DHIS2 v2.38 or higher, see here: Release Notes - DHIS2 Documentation

If you must show program indicators in the Tracker Capture app:

  • create a program rule to count the number of events. Instructions on how to do that can be found here.
  • you will need to create a different program indicator for every event. For example: ME_1 is the score for the first event, ME_2 is the score for the second. To do this, clone your program indicator, and in the filter, add V{counter_DE}==1. Repeat this for the expected number of events, and tick “Display in Form” for each.

Hope this helps
Brian

1 Like

Hi @brian,

You have understood my use case quite correctly

I am using SHIS 2 version 2.36., not 2.38 as you have mentioned and the scores are not displayed correctly. In the example below the event report displays just one score: 66.7 is repeated while the care provider got 3 different scores in each event. (100, 66.7 and 33.33)

Could you please explain this part a bit more?

Thanks.

OK, so we have verified you want to see a score per event, but you are seeing the same score for he entire enrollment.

I think we would need to look into your program indicator to identify the problem. It is likely caused by using an enrollment analytics type program indicator, rather than event analytics type.

Please verify that the program indicator configuration is set to event analytics type, like below.

Please also share the event expression.

If the program indicator has the correct configuration, it can be displayed in a “long” format with event report, as you have shown above.

For the second part, I shared are instructions for creating a separate program indicator for every event in the program. You only need to do this to see these values in the “Indicator Widget” of the Tracker Capture form (the image you shared in your first post). However, from your response, this seems not to be necessary.

Hi @brian,

Part 1

Expression ( sum of yes answers divided by total number of questions) multiplied by 100 to get the percentage

Filter

Thanks

Thanks. Could you please change the aggregation type to NONE and try again.

I do not know the expected behavior of “Last Value in Period (average in org unit hierarchy)” for such program indicators in Event Reports. It is not in the docs. But I suspect that the program indicator is aggregating to the latest program indicator value for the given enrollment.

If you only want the value for each individual event, it is better to use NONE for aggregation type.

Hi @brian,

I have used NONE as the aggregation type, but now nothing is shown in the event report. it is empty.

This aggregation type is not in the docs, but its is in the program indicator configuration page

Thanks

Hi, better maybe if you could try CUSTOM aggregation type.

If it is still not working, then this could be an issue with Event type program indicators for repeatable stages in Event Reports (the program indicator expression aggregates data element vales for all events of a program stage, not just for a single event). I tag @tracker-analytics if they can help further.

1 Like

Hi @brian,

Thank you for your support. Hoping that the tracker analytics team can help.

1 Like

Hi @brian,

Any news about issue? I haven’t found a way to build a program indicator to show score per event for a repeatable stage.

Thanks

Hi @hernandezmachava

Would you please have a look at the following topic which seems related to your inquiry?

Thanks!