Order of data in visualization app

Hi everyone,

I have the following situation:
We have a repeatable stage/ a checklist that calculates a percentage/score. As a demo we have registered Test 1 as a tracked entity and three events. in three different dates.

In the visualization app, we would like to get data in table format like below, displaying the registered person, all the events they went through , event dates and the score per event/stage

image

We welcome all ideas that can help us achieve this

Thanks

Hi @ferdinandmussavene,

The Visualizer app displays data in aggregate results; however, what you are looking for seems to be more suitable in the Event Reports app or preferably in the Line Listing app, you will be able to display detailed tables similar but not exactly identical to the table you pasted. Please have a look at those apps first.

Thank you!

Hi @Gassim,

I had a look at different options available in event report, but it seems no possible to get what I want. Maybe explaining it in another way: We registered individuals who got different scores/percentages (calculated as program indicators) in different events/checklists in a repeatable stage. The question is: How to line list in event report the different scores each individual got over time in that repeatable stage. That’s what I mean by the post above.

E.G. if individual A got 66.66, 100, 33.33, etc in different events/dates in a repeatable stage, how should view this in the event report?

Thanks.

1 Like

Hi @ferdinandmussavene,

In the new Line Listing app (available for 2.38 and above), you can potentially solve this use cases in two different ways:

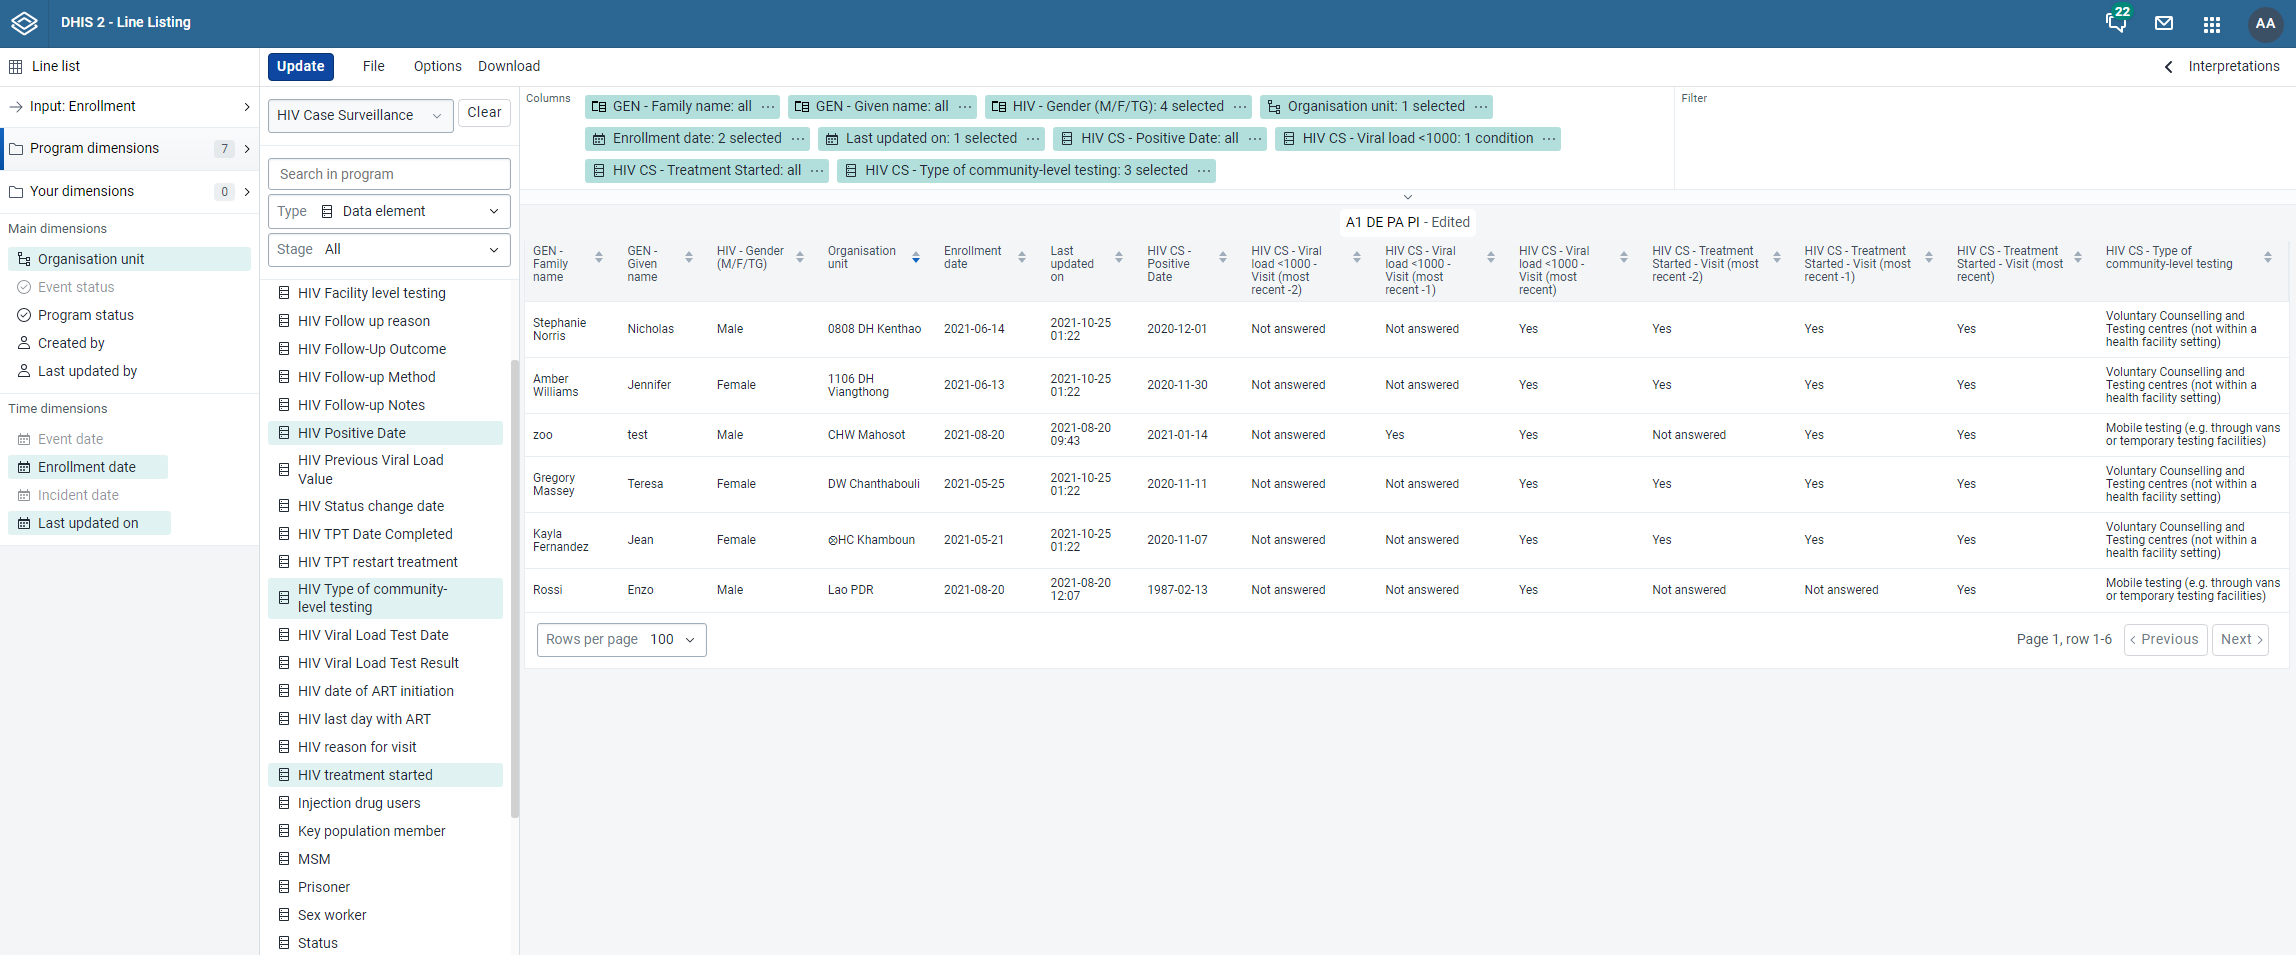
  1. visualize values from multiple repeatable events. Note that this has to be a DE (so can the program indicator somehow be calculated into a DE through a program rule?).
    Example screenshot:
  2. Create program indicator per repeatable event through stageoffset (Follow the explanation in this
    issue
    , so one PI for most recent event, one for event before that (stageoffset-1) etc and add each of them in the line list.

Let me know if you try out either of these solutions with the LL app and if it works!

Thanks in advance,
Karoline
DHIS2 Functional Design

1 Like

Hi @Karoline,

I have read the explanation recommended below, but it is not yet clear for me where to put stageoffset.

Here is the explanation text I copied from the post:

[D][Testing] Selection of repeatable stages in analytics

General

Advanced

Description

If the values of repeatable stages are requested, we are delivering just the latest repeated stage value (latest execution date). This task is to deliver selected stage via index, or all of them.

Indicator example:

Expression:

#{edqlbukwRfQ.vANAXwtLwcT}.stageOffset(0) + #{edqlbukwRfQ.vANAXwtLwcT}.stageOffset(1) - #{WZbXY0S00lP.vANAXwtLwcT}

Filter:

#{edqlbukwRfQ.vANAXwtLwcT}.stageOffset(1) != 0 and #{WZbXY0S00lP.vANAXwtLwcT} != 0

Analytics query example:

dimension=edqlbukwRfQ[1].vANAXwtLwcT

Stage offset value:

1 = first event
2 = second event

-2 = third latest event
-1 = second latest event
0 = latest event(default)

Thanks again.