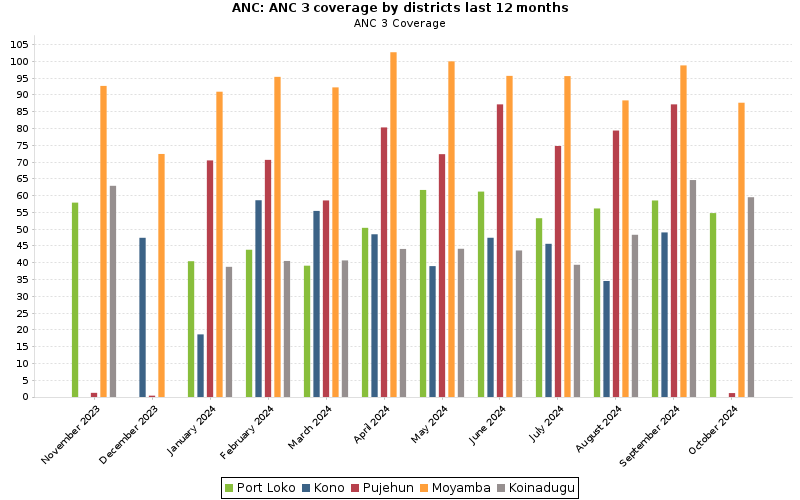
a few questions :
- which version of dhis2 are you using ?
- does the visualiation works “in the browser”
/dhis-web-data-visualizer/#/{id}(without extra params) - which kind of visualisation are you trying to get as an image (not sure every graph type is supported)
From the documentation you might need to pass extra params depending how the period are calculated or you want them to be overridden.
Note that previously the images rendered where really different, sometime not good compared to visualization library in the browser. So not I sure I would rely on the current api for a good looking graph. I think in newer dhis2, they will use a browser less chrome to render the image (not sure when).
see New Push Analytics in 41.1 (Automatically email dashboards)
https://play.im.dhis2.org/stable-2-41-1/api/visualizations/DeRrc1gTMjn/data
