Dashboard performance

Hello everyone

we are having difficulty with our dhis 2 surveillance dashboards.

When multiple users try to access it all the resources of our server are consumed . Often we have to restart the dhis 2 instance.

I know it’s related to the amount of data on the platform, but how can we optimize that?

image

All analyzes on the dashboard are based on indicators

@bobj may be able to help with this!

1 Like

May I ask you to add the specifications and configurations of your server, @didate please! I’m sure that seeing the configurations as well as the specifications would help an expert get a realistic perspective on what the real cause is.

Also, even before someone asking for support, I would like to know if you have a test instance that you could share access to so that even more diagnosis and debugging is possible? Thank you!

Thank you for your response.

Here is the specifications and configurations of the server :

Server : VM on Ubuntu 20 , 100 Go RAM , 24 Cores
Java : 8
PostgreSQL : 13

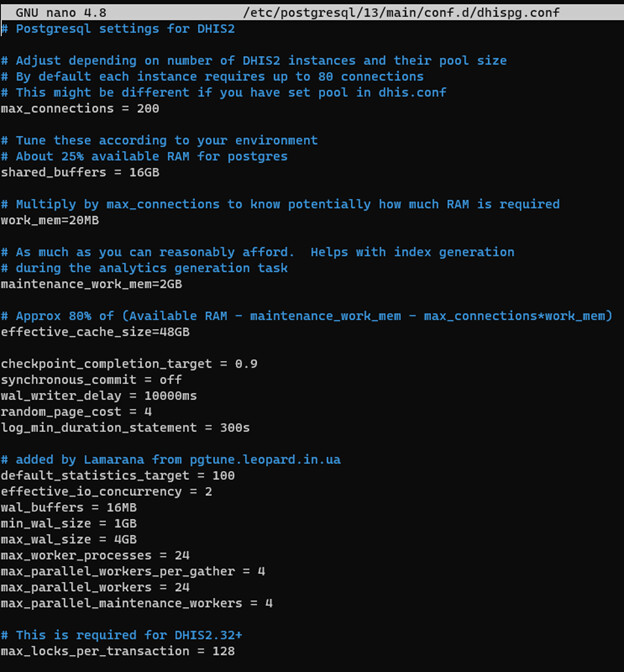
PostgresSQL configuration

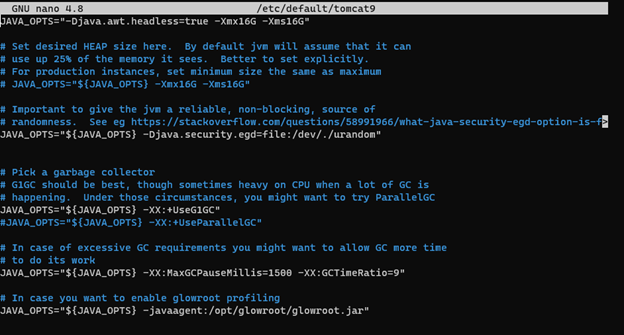
Tomcat Configuration

image

Yes we have a test instance.

You’re welcome my friend! (:

So from the first look,

@Bobj recently recommended a user to not use Java 8 but rather 11:

This seems like an essential update before actually judging the performance, what do you think? I would actually suggest updating Java in the test instance as a start to measure if there’s any difference.

Thanks @didate! (:

Thank you @Gassim. Okey I’m going to try to upgrade Java version.

I’m using dhis 2 Tools LXC installation. I don’t know if there is an easy way to upgrade the Java version ? Or do I have to do that manually in the container ?

1 Like

Hello @Gassim I have installed Java 11 and set it default Java version, but I always have same issues.

1 Like

Are there any configuration changes that you need to make in the setenv.sh file? Please make sure the JAVA_HOME file there is using java 11