Hi @Andrew_Kabala ,
I think I see a few things that may be up here…
First, a database related issue. The error “cannot execute readval() in a read only transaction” is also found here Data Visualizer - SQLState: 25006 Error: cannot execute nextval() in a read-only transaction
For this it would be helpful to know which version of DHIS2 you are using, so if it is related to this bug it can be added to the ticket.
Second and most importantly, I see a possible misalignment between the query you want to make and the PI configuration.
Does this sound like a correct reframing of your requirement?
“I want to count the number of events where the value for data element ART start date falls between the start of the period and the end of the period. An example period I would request in Data Visualizer is the second quarter of 2023”
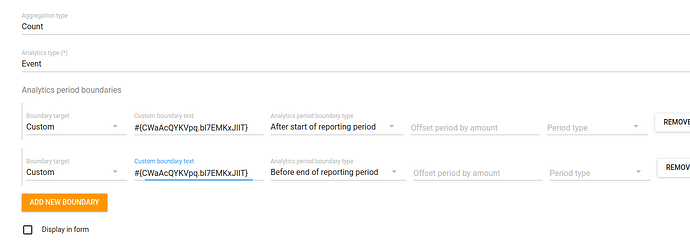
If that is the case, you can use Custom Analytics Period boundaries in the PI configuration.
Analytics Type: Event
Aggregation Type: Count
Expression: V{event_count}
Filter = true
Boundary target = Custom
Custom boundary text = #{programStageUID.ARTStartDateDataElementUID}
Analytics period boundary date = After start of reporting period
Repeat the above boundary wirth analytics period boundary = Before end of reporting period
If for some reason you want to remove enrollments that started after the end of the reporting period (ie after June) where the ART start date was within the reporting period (Apr -June) you could add another analytics period boundary for Enrollment date before end of reporting period.
See here for more details
