Hi all,
I add some screenshot to explain better the problem.
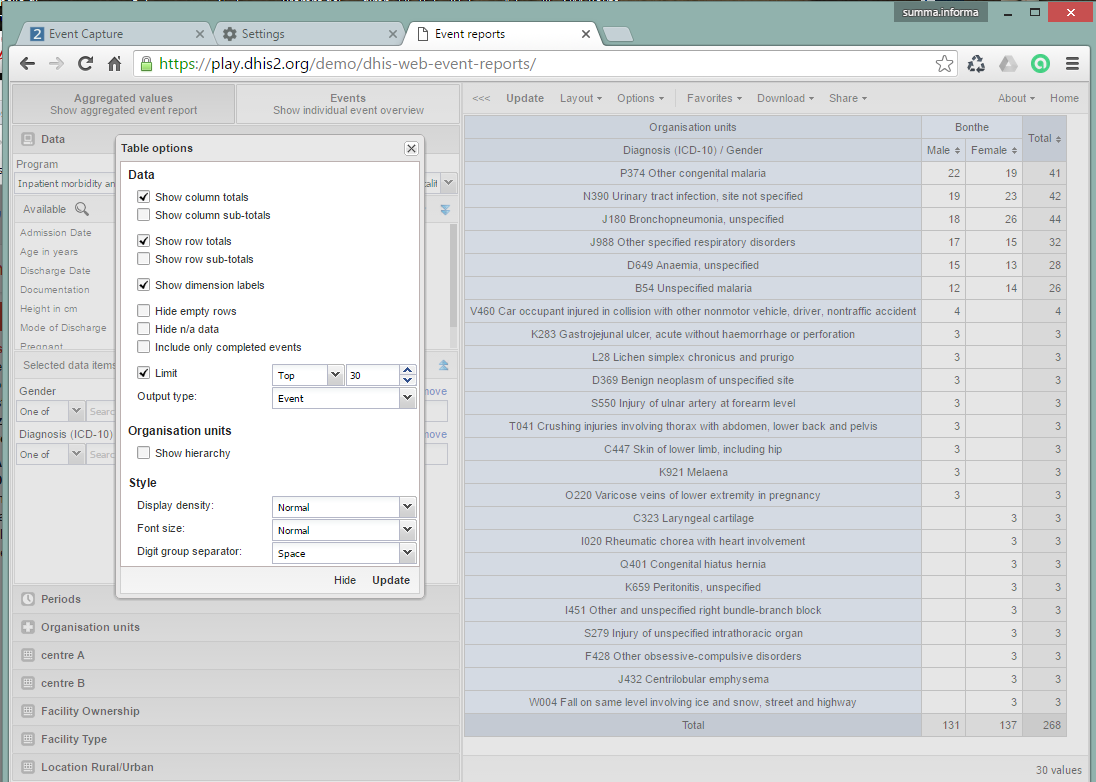
This is the table in Event Report that I created.
I select from the Options menu the Top 30 events for the ICD10 diagnosis
and they appears correctly, ordered by quantity of the events.
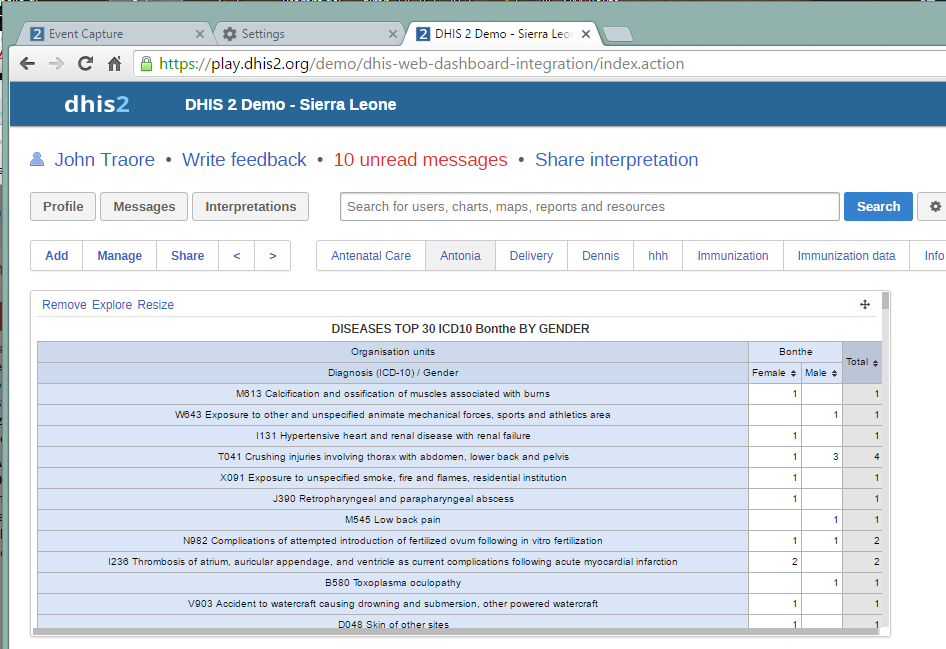
This is what I visualize, when I add this Event Report Table to the
dashboard:
There are visualized ALL the disease by ICD10 not only the top 30 and also
the sum of the events is the sum of all events, not only of the top 30.
Is this a bug?
Thanks for your help.
Antonia
···
2016-06-22 15:27 GMT+02:00 Antonia - Pro <antonia@informa.pro>:
Hi all,
using v.2.22 rev. 22067 but the same problem I reproduce in the Demo
server (2.23 rev. 23020)
I have the fallowing problem:When creating an Event Report Table with selected (in the Options)
Limit: Top 30 Events
The table in the "Event Report" is visualized correctly, but when I "Add"
it tho the Dashboard, the filter of "Top 30 events" is not applied and I
see all ICD10 .. They're not even ordered.I reproduce it also on the *Demo *server (https://play.dhis2.org/demo/\).
If you try it today, you can see it on the:
Dashboard: Antonia
Event Report Table:* DISEASES TOP 30 ICD10 Bonthe BY GENDER*Is this a bug or I make something wrong?
Thanks
Antonia