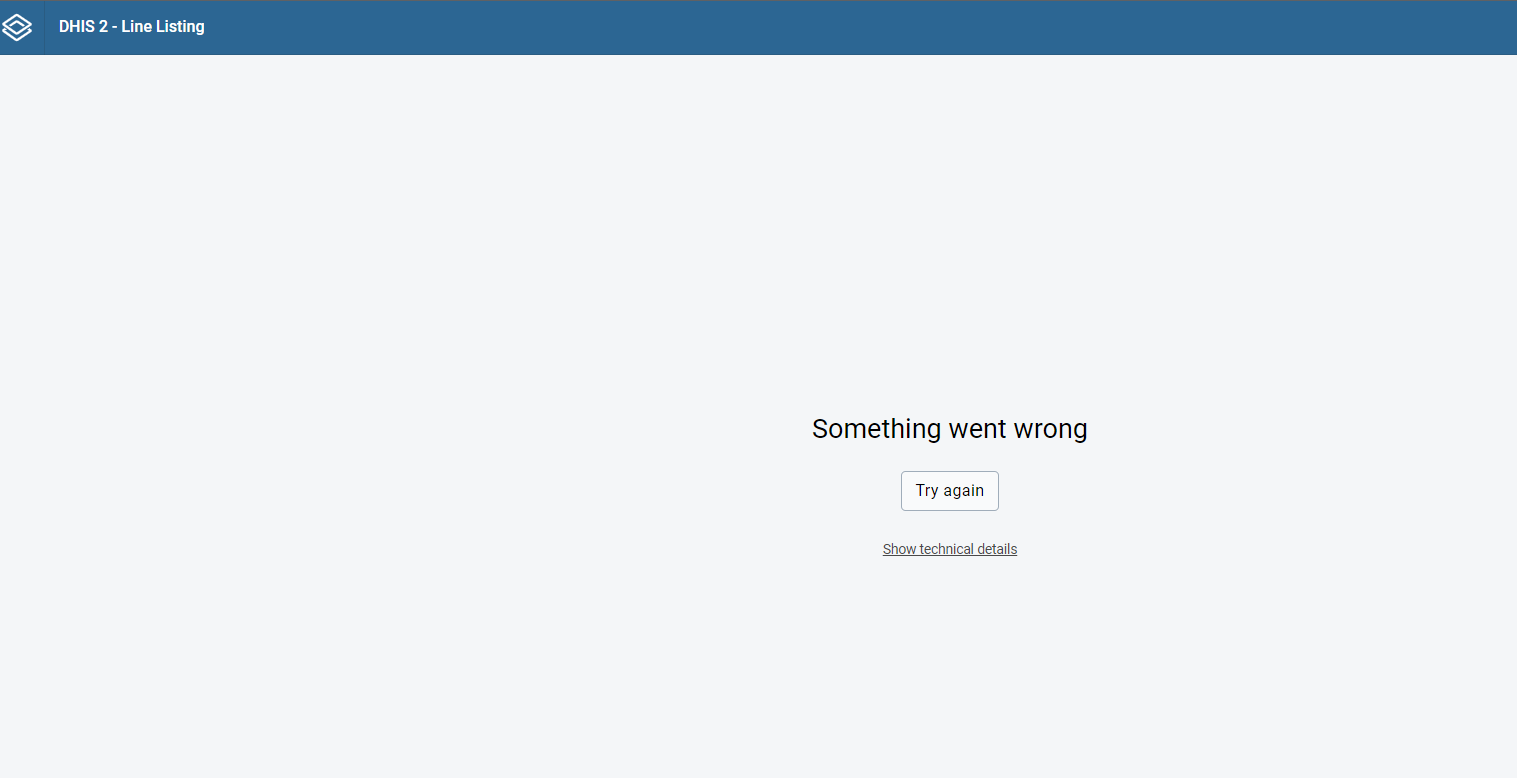
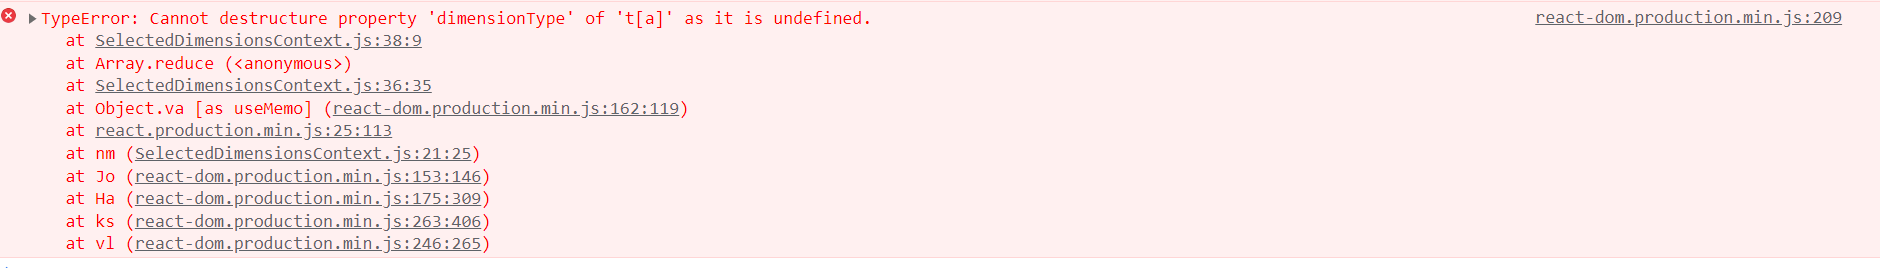
I am getting an error from the linelisting app when visualizing enrollment data from multiple program stages. The linelisting app crashes when saving the visualization and when I try to access the viz from the favourites list. Stange thing is, I am able to visualize the saved output in a dashboard despite the app crashing when trying to save. Error I am getting is as as shown in screen shots below:
Note - have the latest line listing app installed (100.7.0), also tried it with 100.6.1
I am not able to reproduce the issue in play.
Your assistance will be highly appreciated.
Thank you for your post! What is the error message when you click on the ‘Show Technical Details?’ And what version of dhis2 are you using?
Did you try to uninstall the app and install it again? Additionally, to make sure this is not a cache issue, please use the Data Administration app (Maintenance) and click on Clear Application Cache and Reload Apps, and after that please check again in the Guest mode If it’s working on Guest mode then this is simply a cache issue but if it’s not then we need to investigate this further.
If it’s not working in Guest mode, would you check if there are any errors in the Catalina.out log? Please share it completely without sensitive info.
The error showing is the one same message showing in the console.
Using DHIS2 version 40.0.0 . I have tried deleting all the line listing app files from the DHIS2 app directory on the OS, I have installed and reinstalled different versions of the linelisting app from DHIS2 with no success.
I have cleared the browser and application cache several times, I have also tried to access the DHIS2 via guest mode on different browsers, nothing seems to be working.
There is nothing in the catalina.out log concerning the issue.
Would you be able to install a clean version of the whole instance to check again? There errors you are seeing might be related to your database or how it was installed… Thanks!
I tried the linelisting app on Play 40.0.0, it gives the same error. I have a attached a link to the screen recording I made on Play that reproduces the error so you can get a better understanding of what I am trying to visualize.
Thank you so much for the recording! It helped me realize the issue.
The issue is happening when a data element is selected from more than one program stage. I believe this is a bug so would you like to create a bug issue in Projects - Jira and post the jira ticket here?
This happening when we have for example data element “WHOMCH Blood transfusion” present in more than one program stage for example “Care at birth” and “Postpartum care visit,” but if you select the data element from only one program stage the error will not appear.
I think it’s either because it’s supposed to be like this or because the code is expecting that we don’t select the data element more than once.