I am Chathura Widanage from department of computer science and engineering, Univeristy of Moratuwa., Sri Lanka. I am interested in the three proposed projects,
“5. Enhance existing DHIS2 android dashboard application”,
“2. Partial rendering of front-end, ReactJS based applications on JVM by using Nashorn engine” and
“9. Tracker longitudinal charting”.
Though I am more interested about the 9th project idea, I am not that much clear with the description provided. The sample image is also not very much clear. So I would like to know more details regarding the project 9.
I’ll try to elaborate more on this by using a particular use case. In DHIS2 tracker capture app, we are currently able to visualize values of a particular data element (eg: weight of a child) across a time span (eg: at monthly clinic visits in last 2 years). The values are displayed currently as a series and tabular formats.
I assume you are from Sri Lanka. Then you should be familiar with the child health development record kept by mothers, in which height and weight of the children are recorded by midwife every month. In that record, weight and height values are displayed in a chart against time parameter, which is much convenient in obtaining a snapshot idea of trends of weight/height.
We have in fact developed something similar for a particular program sometime back. But a generic solution in tracker capture would be beneficial specially in situations where paper based formats already contains charts etc.
A screenshot of the above mentioned chart in DHIS 2.16 instance is as below.
I am Chathura Widanage from department of computer science and engineering, Univeristy of Moratuwa., Sri Lanka. I am interested in the three proposed projects,
“5. Enhance existing DHIS2 android dashboard application”,
“2. Partial rendering of front-end, ReactJS based applications on JVM by using Nashorn engine” and
“9. Tracker longitudinal charting”.
Though I am more interested about the 9th project idea, I am not that much clear with the description provided. The sample image is also not very much clear. So I would like to know more details regarding the project 9.
Confidentiality Notice: the information contained in this email and any attachments may be legally privileged and confidential. If you are not an intended recipient, you are hereby notified that any dissemination, distribution, or copying of this e-mail is strictly prohibited. If you have received this e-mail in error, please notify the sender and permanently delete the e-mail and any attachments immediately. You should not retain, copy or use this e-mail or any attachments for any purpose, nor disclose all or any part of the contents to any other person.
So the goal of this project is to build graphical elements that will reflect the data(that are currently tabulated) in an effective manner so that it makes sense to the end user than now?
I’ll try to elaborate more on this by using a particular use case. In DHIS2 tracker capture app, we are currently able to visualize values of a particular data element (eg: weight of a child) across a time span (eg: at monthly clinic visits in last 2 years). The values are displayed currently as a series and tabular formats.
I assume you are from Sri Lanka. Then you should be familiar with the child health development record kept by mothers, in which height and weight of the children are recorded by midwife every month. In that record, weight and height values are displayed in a chart against time parameter, which is much convenient in obtaining a snapshot idea of trends of weight/height.
We have in fact developed something similar for a particular program sometime back. But a generic solution in tracker capture would be beneficial specially in situations where paper based formats already contains charts etc.
A screenshot of the above mentioned chart in DHIS 2.16 instance is as below.
I am Chathura Widanage from department of computer science and engineering, Univeristy of Moratuwa., Sri Lanka. I am interested in the three proposed projects,
“5. Enhance existing DHIS2 android dashboard application”,
“2. Partial rendering of front-end, ReactJS based applications on JVM by using Nashorn engine” and
“9. Tracker longitudinal charting”.
Though I am more interested about the 9th project idea, I am not that much clear with the description provided. The sample image is also not very much clear. So I would like to know more details regarding the project 9.
Confidentiality Notice: the information contained in this email and any attachments may be legally privileged and confidential. If you are not an intended recipient, you are hereby notified that any dissemination, distribution, or copying of this e-mail is strictly prohibited. If you have received this e-mail in error, please notify the sender and permanently delete the e-mail and any attachments immediately. You should not retain, copy or use this e-mail or any attachments for any purpose, nor disclose all or any part of the contents to any other person.
Regards,
Pamod Amarakoon
Confidentiality Notice: the information contained in this email and any attachments may be legally privileged and confidential. If you are not an intended recipient, you are hereby notified that any dissemination, distribution, or copying of this e-mail is strictly prohibited. If you have received this e-mail in error, please notify the sender and permanently delete the e-mail and any attachments immediately. You should not retain, copy or use this e-mail or any attachments for any purpose, nor disclose all or any part of the contents to any other person.
I have shared my first draft of the proposal via GSOC web site and I would be grateful if you could give me a feedback on how I can further improve my proposal.
So the goal of this project is to build graphical elements that will reflect the data(that are currently tabulated) in an effective manner so that it makes sense to the end user than now?
I’ll try to elaborate more on this by using a particular use case. In DHIS2 tracker capture app, we are currently able to visualize values of a particular data element (eg: weight of a child) across a time span (eg: at monthly clinic visits in last 2 years). The values are displayed currently as a series and tabular formats.
I assume you are from Sri Lanka. Then you should be familiar with the child health development record kept by mothers, in which height and weight of the children are recorded by midwife every month. In that record, weight and height values are displayed in a chart against time parameter, which is much convenient in obtaining a snapshot idea of trends of weight/height.
We have in fact developed something similar for a particular program sometime back. But a generic solution in tracker capture would be beneficial specially in situations where paper based formats already contains charts etc.
A screenshot of the above mentioned chart in DHIS 2.16 instance is as below.
Hope this helps
–
Regards,
Pamod Amarakoon
Confidentiality Notice: the information contained in this email and any attachments may be legally privileged and confidential. If you are not an intended recipient, you are hereby notified that any dissemination, distribution, or copying of this e-mail is strictly prohibited. If you have received this e-mail in error, please notify the sender and permanently delete the e-mail and any attachments immediately. You should not retain, copy or use this e-mail or any attachments for any purpose, nor disclose all or any part of the contents to any other person.
I am Chathura Widanage from department of computer science and engineering, Univeristy of Moratuwa., Sri Lanka. I am interested in the three proposed projects,
“5. Enhance existing DHIS2 android dashboard application”,
“2. Partial rendering of front-end, ReactJS based applications on JVM by using Nashorn engine” and
“9. Tracker longitudinal charting”.
Though I am more interested about the 9th project idea, I am not that much clear with the description provided. The sample image is also not very much clear. So I would like to know more details regarding the project 9.
Confidentiality Notice: the information contained in this email and any attachments may be legally privileged and confidential. If you are not an intended recipient, you are hereby notified that any dissemination, distribution, or copying of this e-mail is strictly prohibited. If you have received this e-mail in error, please notify the sender and permanently delete the e-mail and any attachments immediately. You should not retain, copy or use this e-mail or any attachments for any purpose, nor disclose all or any part of the contents to any other person.
So the goal of this project is to build graphical elements that will reflect the data(that are currently tabulated) in an effective manner so that it makes sense to the end user than now?
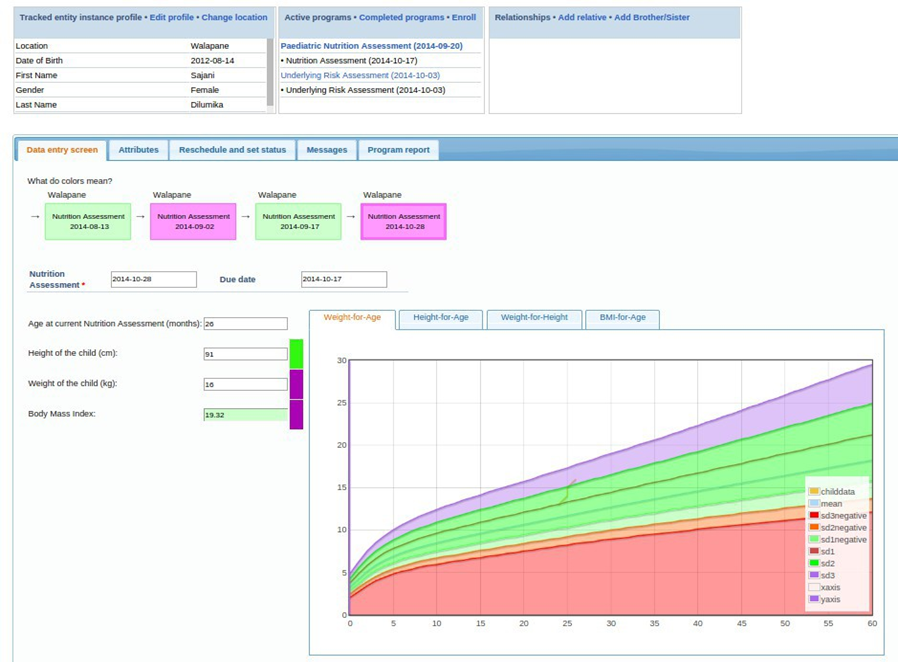
I’ll try to elaborate more on this by using a particular use case. In DHIS2 tracker capture app, we are currently able to visualize values of a particular data element (eg: weight of a child) across a time span (eg: at monthly clinic visits in last 2 years). The values are displayed currently as a series and tabular formats.
I assume you are from Sri Lanka. Then you should be familiar with the child health development record kept by mothers, in which height and weight of the children are recorded by midwife every month. In that record, weight and height values are displayed in a chart against time parameter, which is much convenient in obtaining a snapshot idea of trends of weight/height.
We have in fact developed something similar for a particular program sometime back. But a generic solution in tracker capture would be beneficial specially in situations where paper based formats already contains charts etc.
A screenshot of the above mentioned chart in DHIS 2.16 instance is as below.
<image.png>
Hope this helps
–
Regards,
Pamod Amarakoon
Confidentiality Notice: the information contained in this email and any attachments may be legally privileged and confidential. If you are not an intended recipient, you are hereby notified that any dissemination, distribution, or copying of this e-mail is strictly prohibited. If you have received this e-mail in error, please notify the sender and permanently delete the e-mail and any attachments immediately. You should not retain, copy or use this e-mail or any attachments for any purpose, nor disclose all or any part of the contents to any other person.
I am Chathura Widanage from department of computer science and engineering, Univeristy of Moratuwa., Sri Lanka. I am interested in the three proposed projects,
“5. Enhance existing DHIS2 android dashboard application”,
“2. Partial rendering of front-end, ReactJS based applications on JVM by using Nashorn engine” and
“9. Tracker longitudinal charting”.
Though I am more interested about the 9th project idea, I am not that much clear with the description provided. The sample image is also not very much clear. So I would like to know more details regarding the project 9.
Confidentiality Notice: the information contained in this email and any attachments may be legally privileged and confidential. If you are not an intended recipient, you are hereby notified that any dissemination, distribution, or copying of this e-mail is strictly prohibited. If you have received this e-mail in error, please notify the sender and permanently delete the e-mail and any attachments immediately. You should not retain, copy or use this e-mail or any attachments for any purpose, nor disclose all or any part of the contents to any other person.