Hi. I’m having issues with contradicting values on my DHIS2 instance. The values are input in data entry and some indicators filled as well. However, when I pull the report on data visualizer, the values are different by different margins. I need to correct this, it presents issues of accuracy with my end users.
I’d not know why this contradiction but we need to make sure there’s no error first.
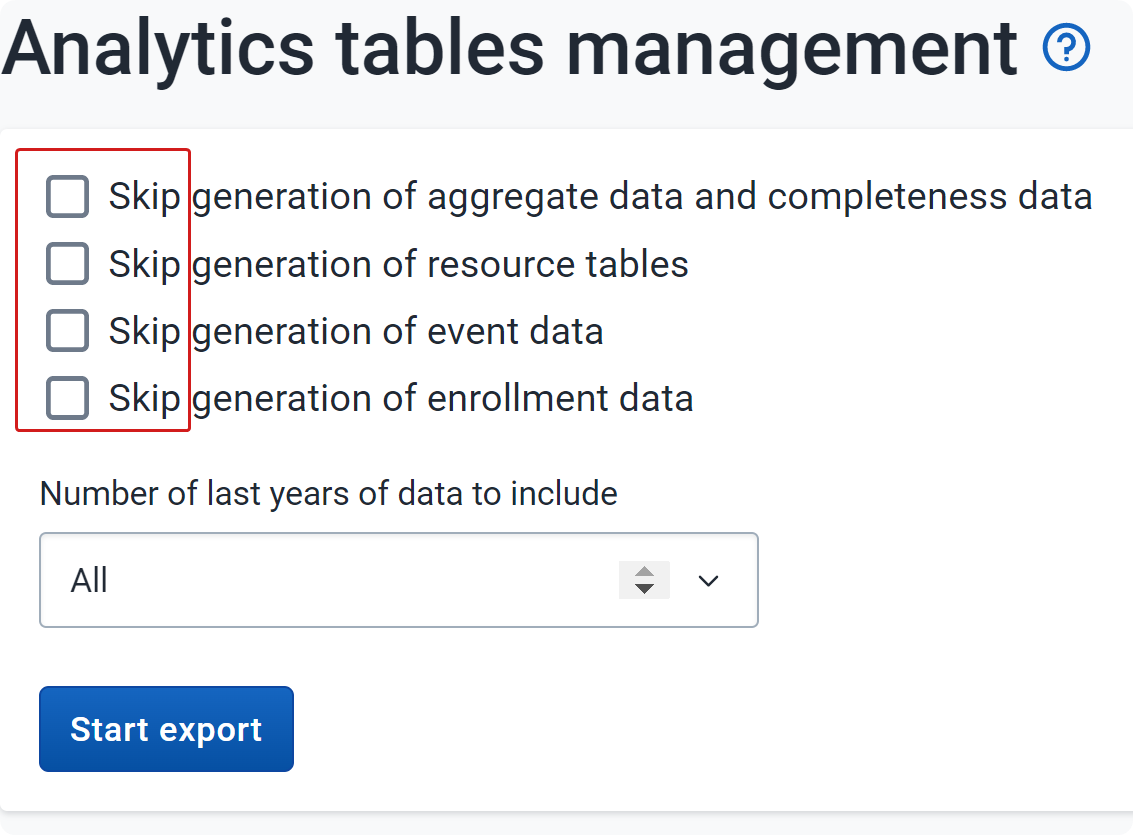
Please check again in a new/different browser/profile, and if it’s still the same, would you please check the Catalina.out log to make sure the tables analytics export runs successfully?
Please share the Catalina.out log (without the sensitive info).
Yes it runs successfully. The log file reads a lot INFO level messages. A few ERROR messages but nothing significant I can pick out thus far. Is there anything particular I am looking for with the files?
Hi @lillian1n2 ,
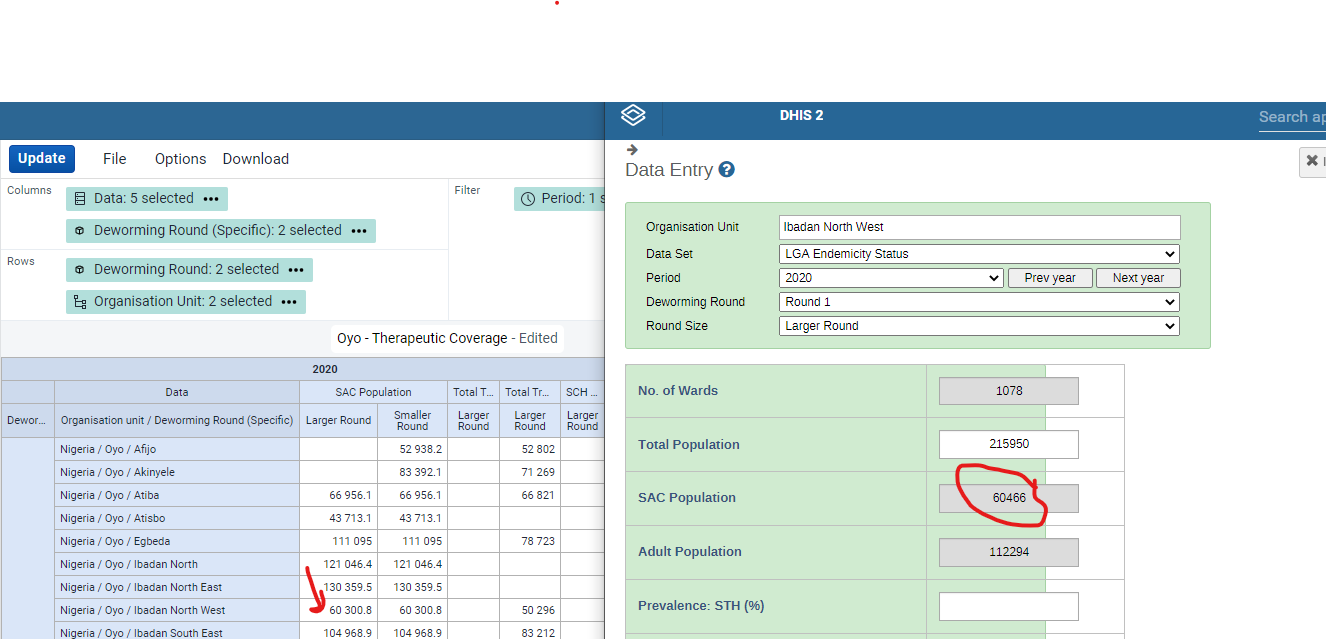
I noticed in the Pivot table you have two rounds selected, but in the data entry app, you are only looking at Round 1. This could account for the differences in values which you are seeing. Please ensure that the parameters which you have selected in the pivot tables match exactly those in the data entry app.
There can be some slight variation in the values seen in the pivot tables and data entry app, due to rounding issues, but normally,these should be very small (one or two).
I highly doubt that is the issue because the category combinations displayed in the screenshot match for data entry and visualizer.
I’ve selected data input in Round 1, Larger Round.
There was no data input in Round 2, so if I scrolled down the table to Round 2, it would be evident. Also I wanted to be clear on the same, which is why I selected both Larger Round and Smaller Round for display.