Hi DHIS2 community!
My name is Martin, I’m the CTO of Bluesquare, a global health data company working a lot with DHIS2. As we deliver end to end solutions for our users (setup, analysis, hosting, configuration, training, custom development, etc), we’ve had regular requests for public portals connected to DHIS2.
We’ve progressively developed a product called Dataviz to tackle this need - producing nice public portals for DHIS2 based projects.
Some example of Dataviz powered portals:
- Performance based financing in Ivory Coast: https://www.fbpcotedivoire.org/data (French)
- Strategic purchasing in Uganda: Dataviz - Bluesquare (English)
- Demo on Sierra Leone DHIS2 play data: http://dataviz-demo.bluesquare.org/data
We have already deployed more than 30 portals using Data Viz, my goal today is to see how this kind of solution would be interesting to you/the project you manage. We want to use the opportunity to use your feedback and expertise to improve the tool and facilitate onboarding.
I’ll detail below how this works, but if interested, please answer the small form here - I’m ready to offer some free trial to the first dozen of projects applying if you agree to a feedback session to help us improve the product.
A bit more info on Data Viz:
Data Viz is a web-based interface that uses selected data from DHIS2 platforms and turns it into an ergonomic public portal accessible to any interested party:
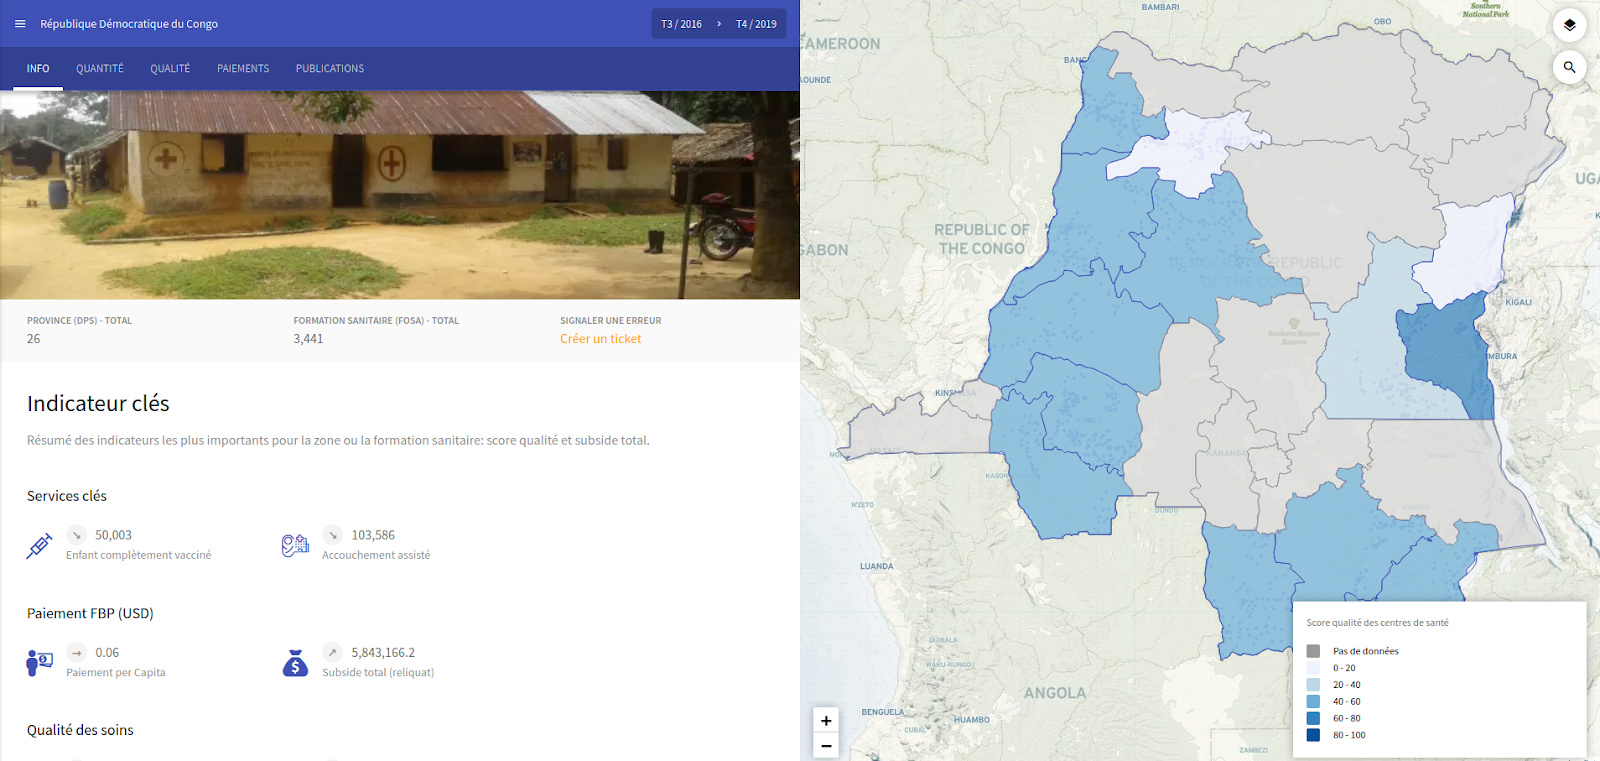
It shows two main areas - selected data on the left and a map on the right. The map is fully clickable, allowing you to drill down from the country to any individual health center in a few clicks.
The portal is fully customizable to decide which data to show, what kind of visualization to use for each part, the levels of the map to allow zooming too, etc.
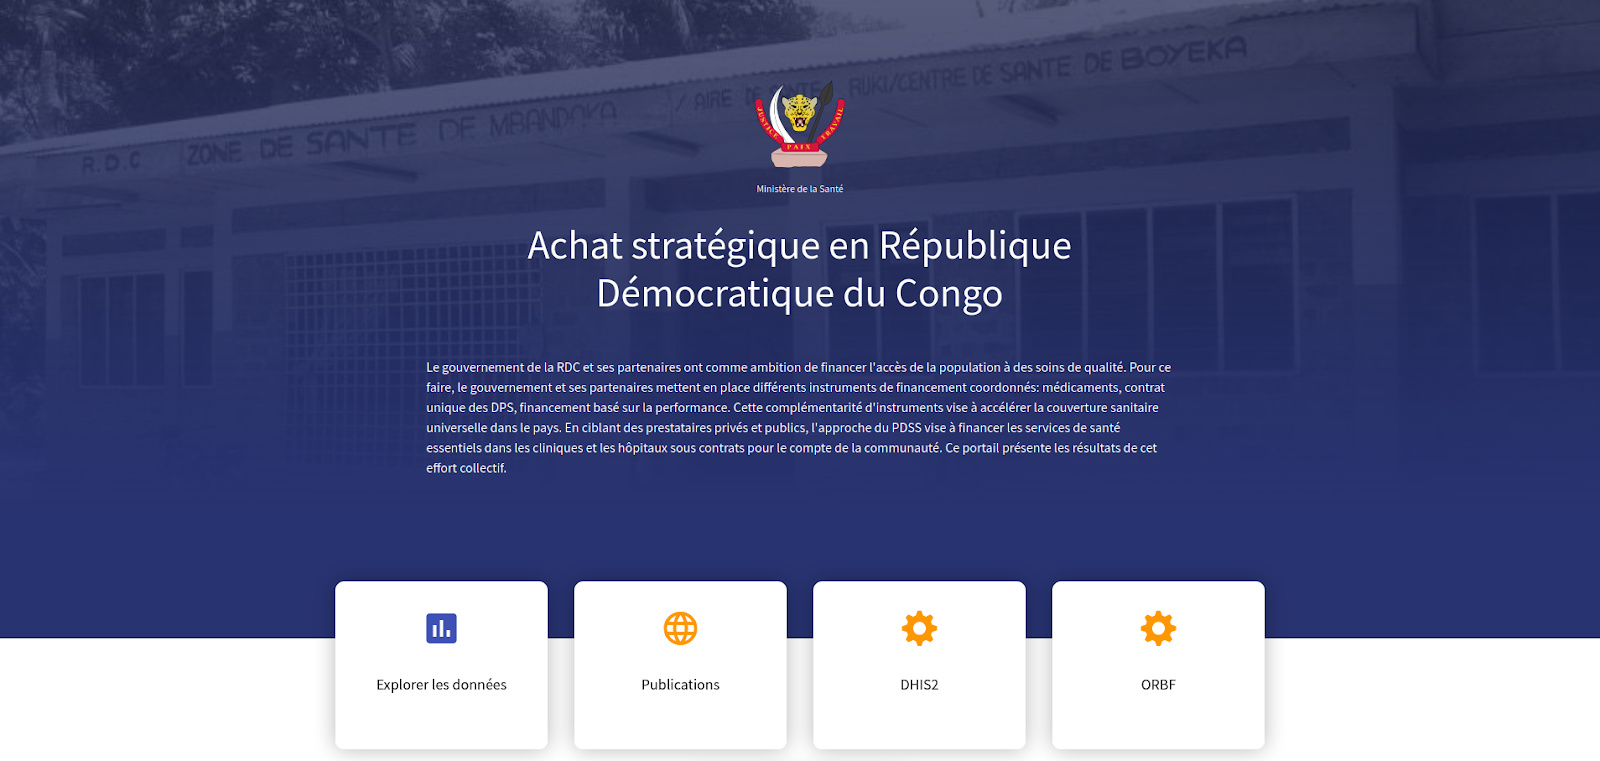
Dataviz also allow to publish post or documents related to the program, serving as a de facto home page for it
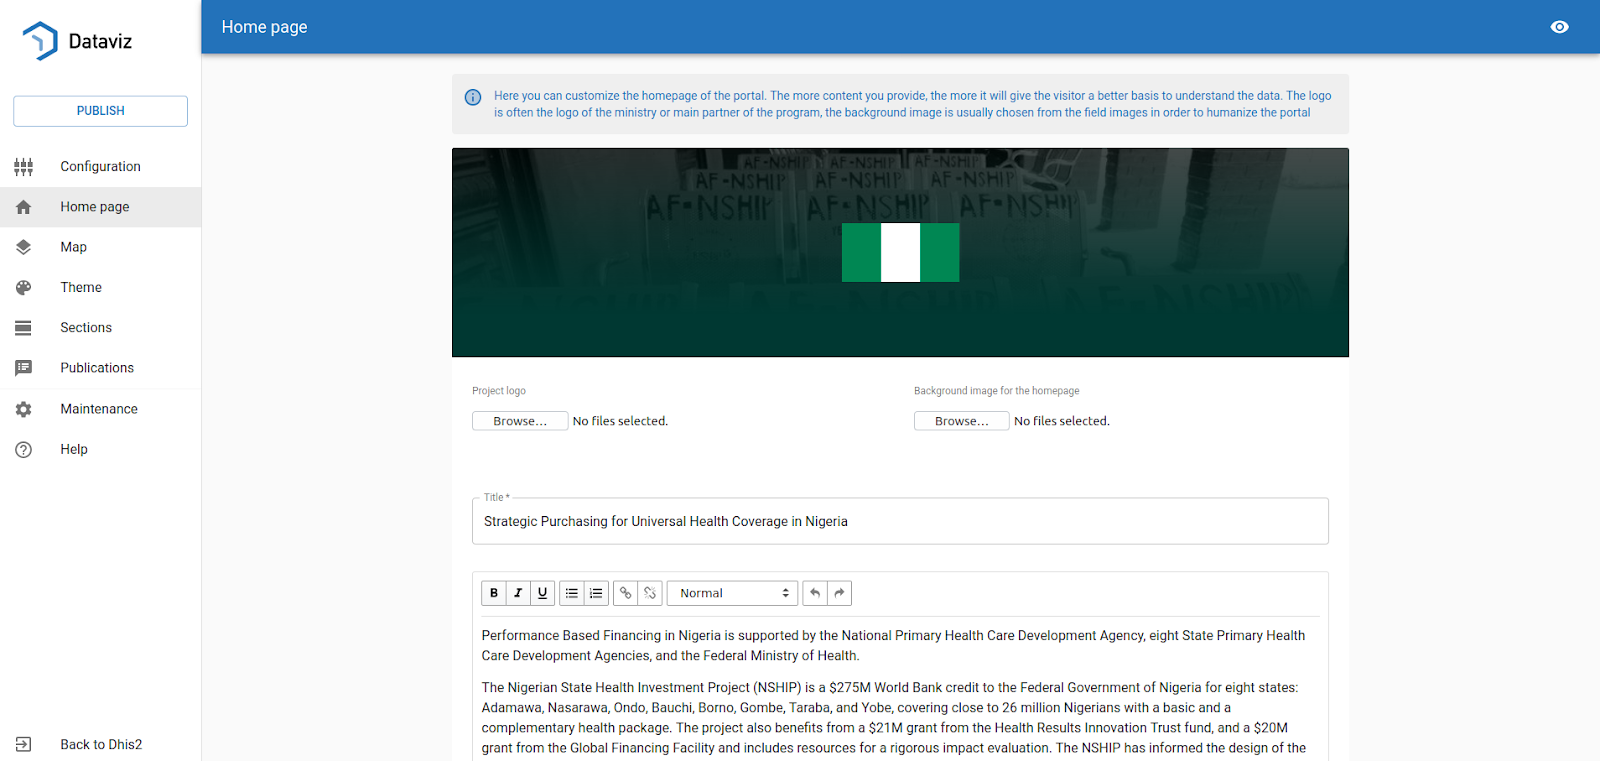
Configuration is done directly from DHIS2 using a dedicated DHIS2 manager application that allows the data manager to update their portal and select the data they want to make public from DHIS2 data element groups, indicators, etc (think what you would put in a pivot table).
That also means that the quality of your portal will be mostly linked to the data you have - as an example, Dataviz uses the shapefiles of the organisation units to show the map - if they are missing that will reduce the attractivity of it.
How does it work under the hood?
Dataviz is made of three parts - a DHIS2 app for the management, an API server to cache the data and a portal front end.
Dataviz API server connects to DHIS2 using the web API (mostly analytics), collects the data that have been selected using the manager application and stores it in a cache for fast delivery on the portal. This is 100% automated to run at night to avoid any load during peak hours (following the DHIS2 team recommendations about external software integration).
This means that once loaded, the portal does not make any request to the DHIS2 (until a refresh is scheduled or required manually).
The portal can be installed under a bluesquare managed domain name or connected to any domain/url you own (in this case we’ll send you the information to put in your DNS records to connect properly).
While the selected data will be available publicly (that’s the portal goal after all!), we take great care in the security aspects, ensuring end to end SSL encryption. As a Brussels based company, we operate under GDPR regulations regarding privacy.
Questions?
Just ask here, I’ll answer.
Interested?
Just fill the form here, and I’ll come back to you as soon as possible.
Thanks!
Martin