Adding data using API but not reflecting that data in Data Visualizer

Hello,

I am adding data using API but that data is not reflecting in data Visualizer

API Link:
curl -d @datavalueset_24032023.xmlhttp://localhost:8080/piramalfoundation/api/dataValueSets” -H “Content-Type:application/xml” -u admin:district

XML File:


ID of Respective

Organisation Unit
Name: LHF
ID: eoxQL9WWS9G

Data Set.pdf (524.5 KB)
Data Set:
Name: KJ Data Set
ID: sUfdkBFlXE5

Data Element.pdf (433.9 KB)
Data Element
Name: KJ data Element
ID: U1He7dxPe77

Indicator.pdf (340.9 KB)
Indicator
Name: KJ Indicator
Id: vDLVyLLTfZQ

No Data Available in Data Visualizer page

Kindly guide me how I can visualize the data in Data Visualizer tab.

Hi @kandarpjoshi

Are you a superuser? Please make sure sharing settings are set properly as well. Moreover, it’s important to run the Data Administration app → Analytics Tables export and then clearing browser cache.

Hope this helps. Thanks!

Yes I am adding data using the Admin user and the organization is also shared with the Admin user.
I have also checked with cross-browser but still facing the same issue.

From Administrator App, I have executed the check “Data Integrity” and found the below result.

Data elements without groups (1)

  • KJ data Element

Indicators without groups (31)

  • KJ Indicator

Organisation units without groups (2)

  • Amrit CCC
  • LHF

Can you please guide me more, what to do from my end?

Shall we connect, so I can share my screen with you? If yes let me know your convenient time (I am from India.)

Hello @kandarpjoshi
The most important here is to make sure you have run the analytics via Data administration → Analytics export.

When running the analytics make sure to follow up until it finish successfully.

Clear the cache and you should be able to see the data

1 Like

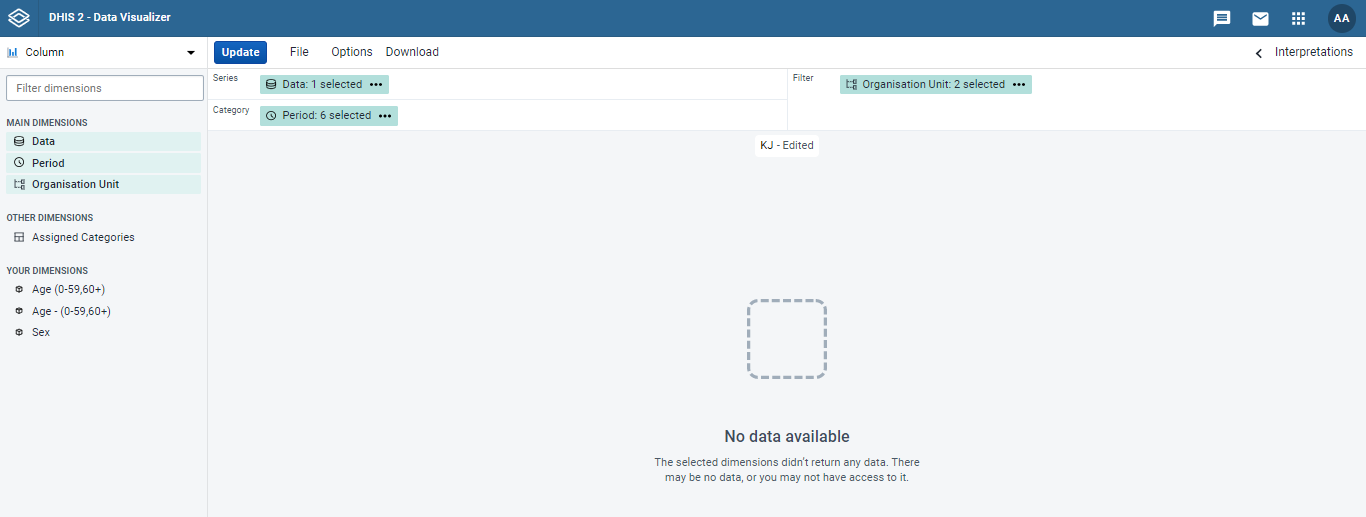
After doing Analytics Table, Getting the data in visualizer tab but everytime I need to execute " Analytics tables". Is there any other source to skip this step and I can get the data in visulizer tabb?

Thanks @tuzoengelbert.
After doing Analytics Table, getting the data in visualizer tab but every time I need to execute " Analytics tables" after my API call.

Is there any other source to skip this step and I can get the data in visualizer tab?

Hello @kandarpjoshi
You can schedule the analytics to run on its own for your desired time

Todo that, Go to “Schedular app” and you will see the interface to schedule analytics to run may be a midnight.

1 Like